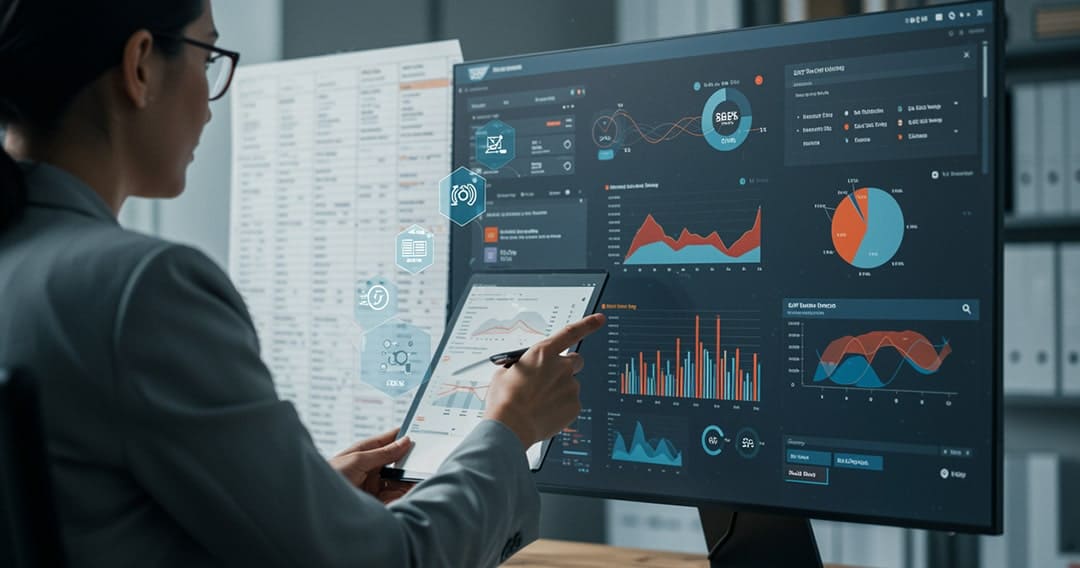
- Dashboards that Drive Decisions: SAP B1 comes with dashboards tailored for finance, sales, purchasing, and inventory. These are role-specific, meaning your CFO sees overdue receivables while your Sales Manager sees pipeline opportunities. Visuals such as bar graphs, trend lines, KPIs, and geo maps make it easier to identify patterns and anomalies. No more navigating through 12 different reports to find out what’s going wrong.
- Interactive Reports with Drill-Down Capabilities: Reporting in SAP B1 isn’t static. Users can interact with reports, click through summary data to see underlying transactions, and even filter in real-time. It brings Excel-like familiarity but with far more robustness and live data integrity. For example, a sales report not only shows overall revenue but allows you to drill down by region, product, or salesperson with a few clicks.
- Power of HANA-Powered Analytics: When SAP B1 is powered by SAP HANA, the game changes completely. You get real-time analytics that can process large volumes of data almost instantly. It enables predictive analytics, real-time dashboards, and what-if simulations. HANA doesn’t just tell you what happened—it starts telling you what might happen and why. That’s a game-changer for growing businesses.
- Crystal Reports for Customisation: For businesses that need highly formatted and print-ready reports, SAP Crystal Reports is integrated into SAP B1. Finance teams especially love this for generating balance sheets, P&L statements, and audit-ready documentation. It’s ideal for companies that have complex reporting needs—compliance, government filings, or detailed vendor/client reports.
- Microsoft Excel Integration: Let’s be honest—Excel isn’t going anywhere. SAP B1 recognises that. With live Excel integration, users can extract data from SAP B1 and keep it in sync with real-time updates, without exporting static files every time. This bridges the gap between robust ERP analytics and the flexibility business users crave.
Use Cases That Make an Impact
- Inventory Optimisation: One client used SAP B1 dashboards to identify dead stock and seasonal patterns, freeing up over 20% of working capital in less than 6 months.
- Cash Flow Forecasting: By visualising receivables and payables across timelines, another firm reduced their short-term loan reliance by 15%.
- Sales Performance Monitoring: Real-time reporting helped a distribution company spot underperforming territories early enough to reallocate resources before quarter-end.
The Takeaway: SAP Business One is not just about capturing data; it’s about turning it into actionable intelligence. And that intelligence needs to be visual, interactive, and accessible. In a time where data is produced faster than ever, businesses don’t need more reports—they need better visualisation. With SAP B1’s suite of analytics tools, SMEs can leap from hindsight to foresight, from guesswork to clarity.
Final Thoughts for Business Leaders: If you’re already using SAP Business One and still stuck in a reporting rut—talk to your implementation partner about HANA, dashboards, and advanced reporting options. If you’re evaluating ERP solutions, factor in analytics as a key decision-making criterion, not an afterthought.
